


Some time ago, my colleagues and I published a paper on temperature changes during curing of Filtek Silorane, Admira (ormocer) and Herculite XRV (microhybrid, control) composites. It was interesting to notice substantially higher temperature rise in Filtek Silorane compared to the other two materials. However, there was no difference in the temperature rise inside the pulp chamber, probably due to the insulating effect of the remaining dentine.
The abstract of this paper may be found on MEDLINE and I will be happy to email the full text to anyone interested in this subject. Feel free to contact me at vesna.miletic@gmail.com
J Esthet Restor Dent 2009;21(2):122-31.
Temperature changes in silorane-, ormocer-, and dimethacrylate-based composites and pulp chamber roof during light-curing.
Miletic V, Ivanovic V, Dzeletovic B, Lezaja M.
STATEMENT OF THE PROBLEM: Light-curing of resin-based composites (RBCs) is associated with temperature increase in the pulp chamber, which may have a detrimental effect on the vital pulp.
PURPOSE: The purpose of the study was to evaluate temperature changes of silorane-, ormocer-, and dimethacrylate-based RBCs at the bottom surface of the RBC and in the pulp chamber roof dentin (PCRD) during curing.
MATERIALS AND METHODS: In part A, temperatures were measured for Filtek LS (3M ESPE, St. Paul, MN, USA), Admira (Voco GmbH, Cuxhaven, Germany), and Herculite XRV (Kerr Corp., Orange, CA, USA) with a high-power light-emitting diode (LED) unit by placing thermocouples in contact with the bottom surface of the material in standardized acrylic molds. In part B, temperature changes in PCRD were measured in extracted molars during light-curing of adhesives and RBCs in 2-mm-deep cavities with a remaining dentin thickness (RDT) of 1 mm.
RESULTS: Filtek LS showed a different temperature curve compared with Admira and Herculite XRV. Significantly higher temperatures were recorded for Filtek LS (p < 0.001) than for Admira and Herculite XRV in acrylic molds. Temperature rises recorded in PCRD for adhesives and RBCs were between 4.1 and 6.4 degrees C. No significant differences in PCRD temperatures were found between the three groups during adhesive curing and RBC curing (p > 0.05).
CONCLUSIONS: Filtek LS showed a different heat-generation pattern from and significantly higher temperatures than Admira and Herculite XRV when the materials were tested in acrylic molds. Similar temperatures were recorded in the PCRD during curing of adhesives and RBCs.
CLINICAL SIGNIFICANCE: Although a substantial temperature rise in the bulk material occurred during light-curing of the three resin-based composites, a remaining dentin thickness of 1 mm caused a significant reduction in pulp chamber roof dentin temperatures. Temperatures measured in the pulp chamber roof dentin corresponding to the zone occupied by the postmitotic odontoblast layer were not statistically different for the three types of resin-based composites.
***********************************************************************************
Sunday 21 March 2010
Wednesday 17 March 2010
Free live dental webinar @ GC Learning
Glass Ionomers: A Therapeutic Alternative to Direct Composite Restorations
Presenter: Dr Daniel Ward, D.D.S.Time: 23-March-2010. 7:00 pm ET (midnight, 12 am GMT, 24-March-2010)
This webinar is credited with 1 CE credit.
Prior to entering the class, you have to create an account for free.
*************************************************************************************
Sunday 14 March 2010
News from jobs.ac.uk
Reader in Biomaterials
The University of Manchester - School of Materials
Salary: £46,510 - £60,685 p.a.
Application deadline: 23 - March - 2010
Click here for more information.
*************************************************************************************
The University of Manchester - School of Materials
Salary: £46,510 - £60,685 p.a.
Application deadline: 23 - March - 2010
Click here for more information.
*************************************************************************************
Friday 12 March 2010
Refractive Index of Methacrylate Monomers & Polymers
It is my pleasure to share this post originally published by Esstech, Inc. www.esstechinc.com
************************************************************************************
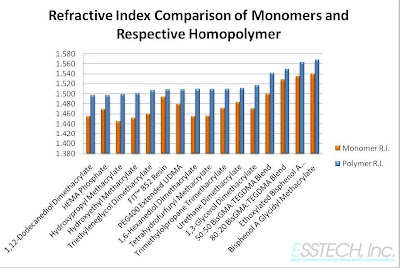
TECHNICAL BULLETIN: Refractive Index of Monomers and Their Respective Polymers
The refractive index (RI) of photopolymers is an essential property for many applications. For optical and coating applications, the RI can be related to the resultant gloss or clarity upon cure. Within the dental industry, the refractive index of the organic polymer matrix, must match that of the inorganic filler and substrate in order to avoid obvious “lines” where the product is applied.
Various factors affect refractive index values. The presence of conjugated ring structures contributes to increasing RI. In general, larger molecular weight monomers have a tendency to possess a higher RI in comparison to their lower molecular weight counterparts. Similar to this trend, high molecular weight functional groups like methacrylates have higher RI than their acrylate counterparts. Higher atomic weight atoms also seem to be predisposed to having higher RI.
Recognizing the importance of refractive index to our customers, Esstech has assembled RI data for a portion of our existing monomer products as well as their corresponding homopolymers.
Maintaining its position as an industry innovator, Esstech has also created functional, high refractive index materials. Contact us to learn more about these novel materials and how Esstech can make a material to match your application.
(P) 800-245-3800 / (P) 610-521-3800 / techsupport@esstechinc.com / www.esstechinc.com
***********************************************************************************
************************************************************************************
TECHNICAL BULLETIN: Refractive Index of Monomers and Their Respective Polymers
The refractive index (RI) of photopolymers is an essential property for many applications. For optical and coating applications, the RI can be related to the resultant gloss or clarity upon cure. Within the dental industry, the refractive index of the organic polymer matrix, must match that of the inorganic filler and substrate in order to avoid obvious “lines” where the product is applied.
Various factors affect refractive index values. The presence of conjugated ring structures contributes to increasing RI. In general, larger molecular weight monomers have a tendency to possess a higher RI in comparison to their lower molecular weight counterparts. Similar to this trend, high molecular weight functional groups like methacrylates have higher RI than their acrylate counterparts. Higher atomic weight atoms also seem to be predisposed to having higher RI.
Recognizing the importance of refractive index to our customers, Esstech has assembled RI data for a portion of our existing monomer products as well as their corresponding homopolymers.

Maintaining its position as an industry innovator, Esstech has also created functional, high refractive index materials. Contact us to learn more about these novel materials and how Esstech can make a material to match your application.
(P) 800-245-3800 / (P) 610-521-3800 / techsupport@esstechinc.com / www.esstechinc.com
***********************************************************************************
Saturday 27 February 2010
The effect of light source on monomer conversion of dental adhesives
The most recent paper by Santini Miletic research group will be published in Journal of Adhesive Dentistry, hopefully in the next issue. The abstract is available on PubMed/MEDLINE.
J Adhes Dent. 2009 Nov 27. doi: 10.3290/j.jad.a17855. [Epub ahead of print]
J Adhes Dent. 2009 Nov 27. doi: 10.3290/j.jad.a17855. [Epub ahead of print]
Micro-Raman Assessment of the Ratio of Carbon-Carbon Double Bonds of Two Adhesive Systems Cured with LED or Halogen Light-curing Units.
Miletic V, Santini A.Purpose: The purpose of the study was to compare the ratio of carbon-carbon double bonds (RDB) of two adhesive systems cured by five different light-curing units (LCUs) using micro-Raman spectroscopy.
Materials and Methods: Ten samples of an etch-and-rinse (Excite), a two-step self-etching adhesive system (AdheSE) - ie, primer and bond mixed - and AdheSE Bond only were prepared and cured with one of the following LEDs: Elipar Freelight2; Bluephase; SmartLite; Coltolux, each for 10 s; or a conventional halogen Prismetics Lite for 10 s or 20 s. Micro-Raman spectra were obtained from uncured and cured samples of all three groups to calculate the RDB. Data were statistically analyzed using ANOVA.
Results: The mean RDB values were 62% to 76% (Excite), 36% to 50% (AdheSE Primer+Bond) and 58% to 63% (AdheSE Bond). At 20 s, Prismetics Lite produced significantly higher RDB in Excite than the other LCUs and Prismetics Lite at 10 s (p < 0.05). Prismetics Lite at 20 s and Elipar produced comparable RDB values of AdheSE Bond and AdheSE Primer+Bond (p > 0.05). Excite showed significantly higher RDB values than AdheSE (p < 0.05) whilst AdheSE Bond showed significantly higher RDB than AdheSE Primer+Bond (p < 0.05).
Conclusion: The etch-and-rinse adhesive cured with the halogen LCU for 20 s gave higher conversion than LED LCUs or halogen for 10 s curing time. The highest intensity LED [Elipar] produced higher or comparable conversion compared to the lower intensity LED LCUs for the same curing time. The etch-and-rinse adhesive showed higher RDB than the self-etching adhesive system. The presence of the primer in the self-etching adhesive compromised polymerisation.
***********************************************************************************
Thursday 18 February 2010
News from jobs.ac.uk
PhD Studentship in Biophysical Chemistry
University of Bristol - Department of Oral & Dental Science
Deadline: February 25, 2010
Salary: around £13,000 plus tuition fees paid.
NB: Applicants should be from the UK or EU. They are unable to support applications from outside the EU.
*************************************************************************************
*************************************************************************************
Monday 8 February 2010
Statistics in dental materials research: 2 things to plan ahead

(1) What statistical test(s) will be used to test the null hypothesis/hypotheses?
It is recommended to design the experiment in such a way that it is possible to test the data using one “global” test such as analysis of variance (ANOVA). The effect of one independent factor on one response variable is tested using one-way ANOVA in many papers on dental materials. Such study design includes e.g. the comparison of the degree of conversion (DC) of several materials cured under the same curing conditions (light, intensity, time, distance). The null hypothesis would be that there is no difference between the means for different materials. So, the independent factor is ‘material’ and the response variable is ‘DC’.
Two-way ANOVA is used to test the effect of two independent factors, e.g. material and light-curing unit (e.g. 3 materials are cured with either a halogen or an LED light-curing unit). Testing for interaction between the two factors shows whether or not the differences caused by one factor are consistent on different levels of the other factor. If so, the interaction is not significant (e.g. the DC may be higher in each material when cured with a halogen unit than an LED unit). Alternatively, if these differences are not consistent, then the interaction is significant (the DC may be higher in some materials when cured with a halogen and in others when cured with an LED unit). In this case, a series of one-way ANOVA must be used to examine this interaction more closely. This will, however, result in multiple testing which by default increases the chance of making the Type I Error (rejecting the null hypothesis when it is true) and some sort of correction is necessary to keep the overall significance level at the usual alpha=0.05. This correction most often means a decrease in the individual alpha value which also reduces the power of the statistical test.
Three-way ANOVA is sometimes used in dental materials science to study the effect of three independent factors on a particular response variable (e.g. the effect of material, light-curing unit and curing time on the DC of resin-based composites). Researchers are often tempted to test more and more factors in order to make their experiments robust. However, one has to keep in mind that the interpretation of three-way ANOVA is more difficult that that of two-way ANOVA and the post-test corrections may significantly reduce the power of the test. These are by no means the only tests used and are only an indication of the type of studies carried out in dental materials science.
(2) Power and sample size – power is the probability of not making Type II Error (failing to reject the null hypothesis when is false) i.e. power is the probability of correctly rejecting the null hypothesis when the difference between the groups truely exists. In sample size calculation prior to an experiment, the power of 80% is generally used as the cut-off point. So, when calculating the number of samples for each group, we need to know the following: number of levels (groups) that we will be comparing; significance level; power; estimated standard deviation (determined in a pilot study or taken from the literature) and the difference between the groups that we consider clinically relevant and don’t want to miss in our statistical testing. This last one may be tricky, because we often don’t know what difference between the groups is clinically relevant in a way that might affect the clinical performance of the tested materials. In this case, we may base our decision on the literature data or we can do a pilot study to find out the likely difference in the response variable between our groups which we would then use in the sample size calculations. Alternatively, if we already have a pre-determined number of samples in each group, we may be able to determine the power of our statistical test (i.e. how certain we are that our conclusion is correct).
***********************************************************************************
Subscribe to:
Posts (Atom)